Network analysis
The connection to the current home page or the current URL can be checked with the integrated Network Analysis tool. Here, requests are automatically sent to the current URL at a specified interval.
This useful tool is often used either at the beginning of a project or when problems arise. Depending on the network coverage, the size of the warehouse and the materials stored, the quality of the network connection can vary greatly. If you're having problems with connections dropping or data not being fully transmitted, this tool can help find out if network coverage needs to be improved in certain places. In the upper area there is information about the current request and general data. This includes the shortest and longest query. In addition, the average duration of the inquiries and the error rate of these are given.
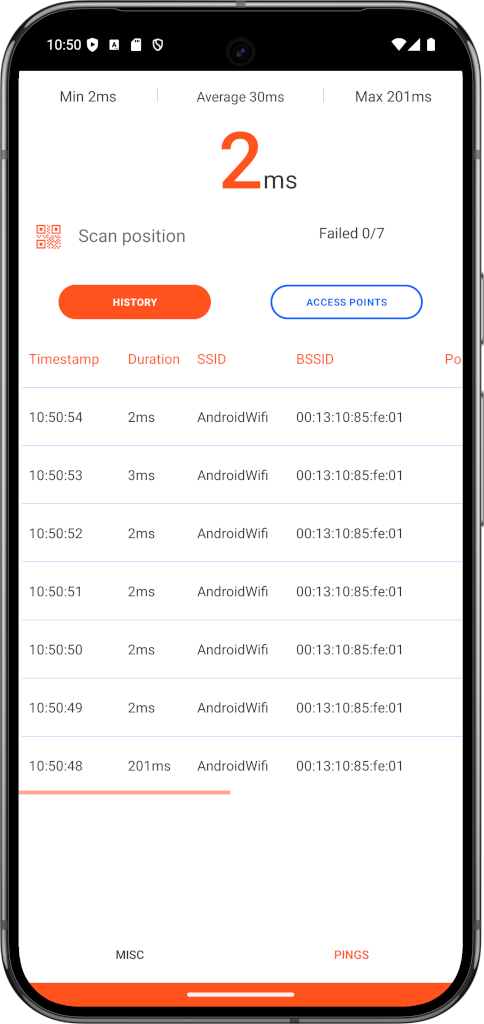
To the left of the error rate is an input field with a button. Here a place can either be entered manually or scanned. Scanning works with the button next to it.
Specifying a location can be used to subsequently evaluate at which locations in the warehouse or production the network connection was bad.
The list of all past requests is given in the lower section. The following data is supplied with each request:
- timing
- Duration
- SSID
- BSSID
- Position
- URL
If a connection to the URL is not possible, an error is given instead of the duration. Clicking on an entry opens more detailed information, describing the error message in more detail.
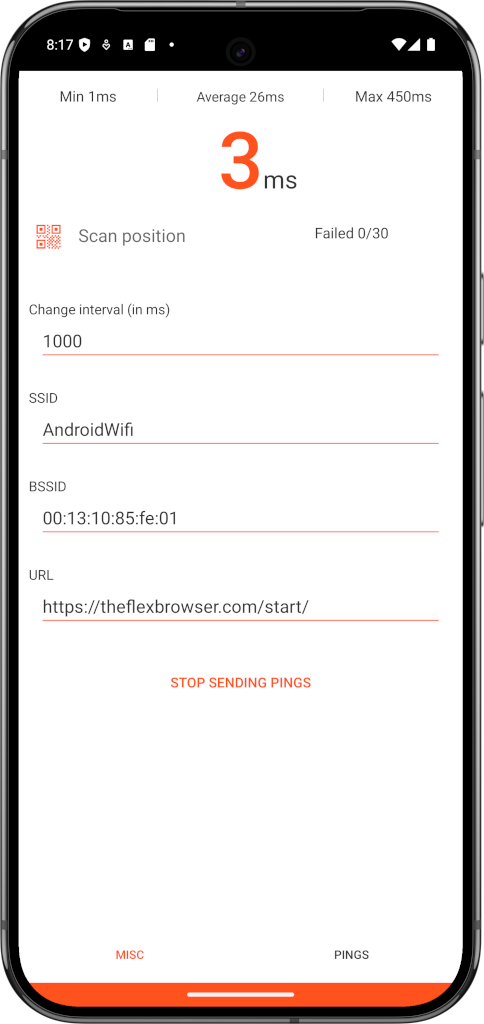
With the menu item Access Points you can switch to a list of access points. Here all queries are grouped according to the BSSID field. At the bottom of the screen is the Miscellaneous (MISC) tab. By clicking on it, the lower section of the network analysis changes to a new view. The following information can be found here:
- interval
- SSID
- BSSID
- URL
- Pause / resume sending requests
The interval can be changed. This is given in milliseconds. However, it is not possible to change the interval below 100ms. The SSID, BSSID & URL are the data for the current connection. By clicking on the button it is possible to pause or resume the sending of requests. This will automatically switch back to the request view.
All sent requests are written to a log file. This file can be found at /flx_logs/flx_mbl.log.